Spotify Data Analysis
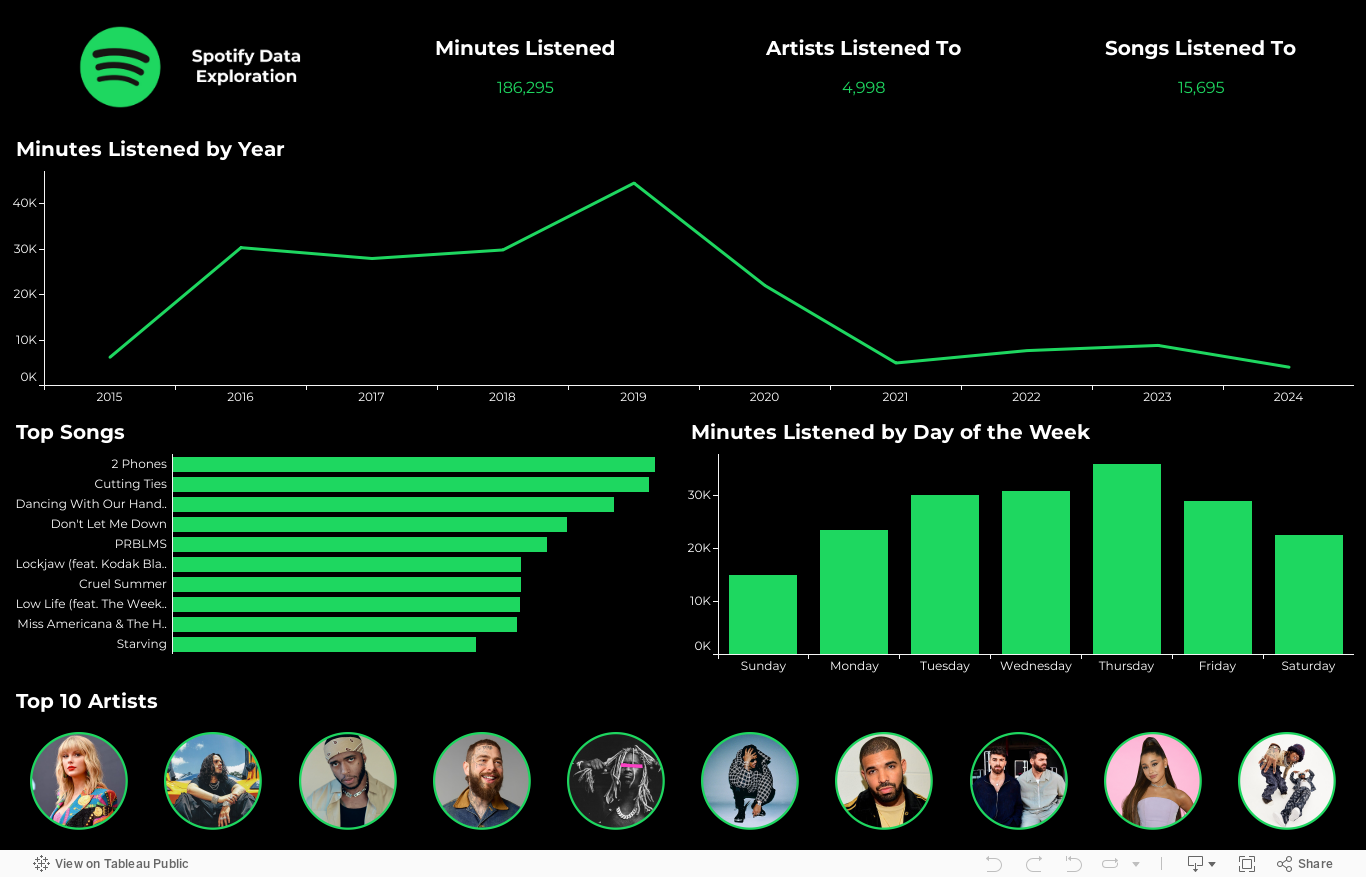
I downloaded my entire Spotify listening data since 2016 to create this Tableau visualization.
I began by cleaning the data, removing blanks, and adjusting formatting.
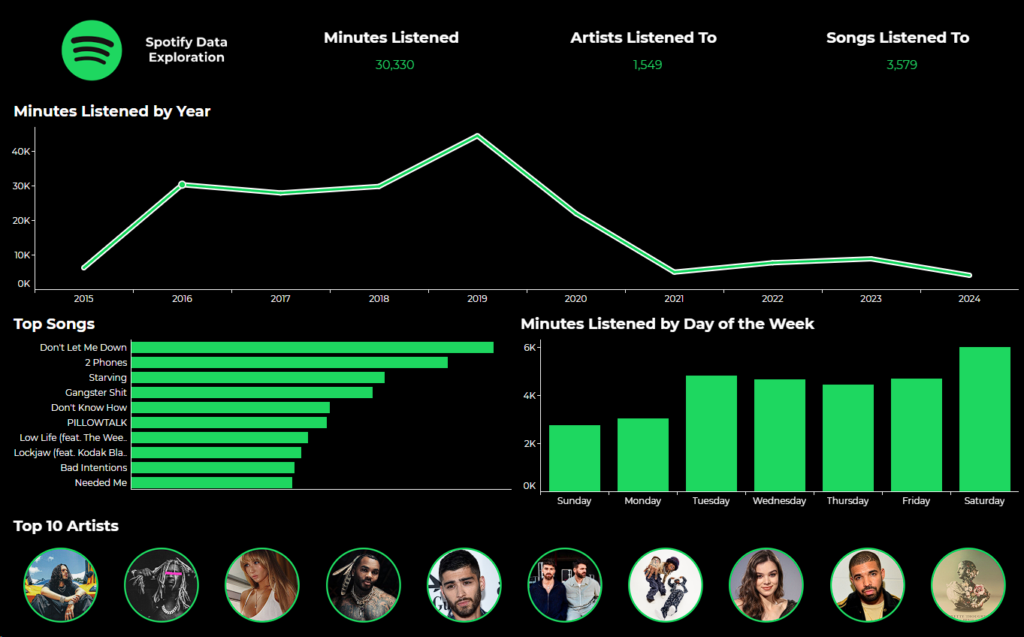
Then I created my visualization. All of the charts and data can be filtered by clicking a year in the minutes listened graph.